Hurstpierpoint Weather Graphs
Latitude N 50° 56' 11" Longitude W 00° 10' 47" Elevation 120 ft
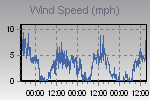
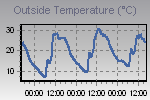
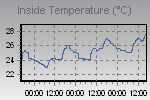
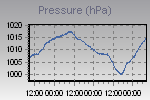
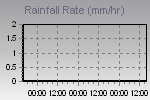
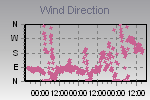
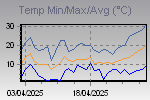
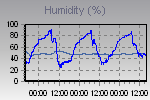
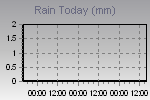
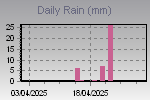
These graphs present the temperature, pressure, rainfall, and wind speed trends for the last 72 hours.
The thumbnail graphs are sampled every ten minutes. Click on a thumbnail to display the corresponding larger graph in the panel above it. The large graphs are sampled every minute.

| Click on a thumbnail to show a large graph in the panel above. | ||||
 |
 |
 |
 |
 |
 |
 |
 |
 |
 |
Page updated 02/07/2026 23:30:00
powered by
Cumulus v1.9.4 (10992)